Leveraging Machine Learning to Predict Surgical Outcomes in Ophthalmology
Introduction
Keratoconus is a degenerative corneal disease where the cornea thins and warps into a cone shape, causing severe visual impairment. One established surgical option is intrastromal corneal ring segment (ICRS) implantation — small arc-shaped inserts that mechanically flatten the cornea and reduce optical distortion. The surgery works well for many patients, but outcomes are unpredictable: about 25% see no meaningful improvement, and roughly 5% end up with worse vision than before.
As part of the MLOps infrastructure I’m building at Quinze-Vingts Hospital in Paris — a system designed to serve clinicians with 24/7 AI-assisted diagnosis — this study was one of the first end-to-end validation cases. The goal wasn’t just to train a model on a research dataset; it was to prove that the full pipeline, from raw device exports to clinical predictions, could work reliably enough to integrate into the hospital’s diagnostic workflow.
The full paper (open access) is published in Cornea (2025): read it here, or download the PDF.
The Clinical Problem
Keratoconus affects roughly 1 in 2,000 people. The corneal irregularities go beyond simple refractive errors — they introduce high-order aberrations (coma, trefoil, spherical aberration) that scatter light in ways glasses can’t correct. ICRS surgery aims to flatten the cone and reduce these aberrations, but the response depends on many interacting factors: corneal thickness, curvature, the ring segment geometry, and disease severity.
We framed this as two ML problems:
- Classification: Will the patient gain more than 1 line of visual acuity? A binary outcome to help determine surgical candidacy.
- Regression: What will the actual postoperative values be for visual acuity, keratometry, and corneal asphericity? Quantitative targets for surgical planning.

Data and Preprocessing
The dataset comprised 120 eyes from 102 keratoconus patients who underwent ICRS implantation between 2021 and 2024. Two data sources fed the pipeline:
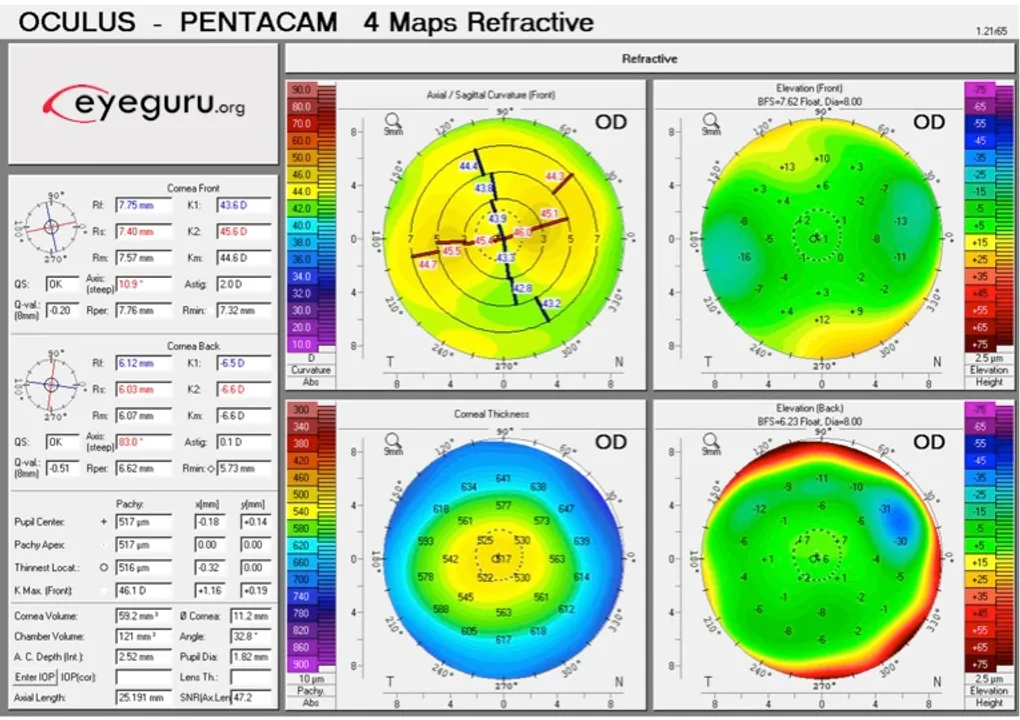
- MS-39 topography: Raw CSV exports containing standard topographical measurements — sagittal anterior curvature, tangential curvature, pachymetry — in polar coordinates across 2–7mm diameter zones. This is the standard grid of points that corneal topographers output.
- Clinical records: Refractive measurements (LogMAR visual acuity, spherical equivalent, cylinder), patient demographics, and surgical parameters.
Building the Data Pipeline
This is where the bulk of the engineering work happened — and where the pipeline needed to be robust enough to eventually run autonomously as part of the hospital’s MLOps infrastructure.
The MS-39 exports its data in polar coordinates — the standard grid of topographical points that corneal topographers produce. That’s fine for the device’s own visualization, but useless for ML. I built an automated pipeline that converts every export from polar to Cartesian coordinates, transforming the radial sampling into a regular spatial grid suitable for computational analysis. The pipeline handles multiple diameter zones (0–7mm), validates reconstructions against the device’s built-in software output, and produces normalized topographic maps ready for feature extraction.
Outlier Detection and Validation
With clinical data from real devices, noise is a constant problem. Sensor artifacts, patient movement during acquisition, corrupted exports — all of these produce values that would silently poison a model if left unchecked. The pipeline applies median z-score filtering at multiple stages: on raw topographical values (rejecting physiologically implausible measurements), on reconstructed map residuals (flagging poor fits), and on the extracted features themselves. Values outside defined physiological bounds are masked and either imputed or the sample is flagged for manual review.
This validation step was critical for building trust with the clinical team. If the pipeline’s output can’t be explained and verified against what the clinician sees on the device screen, it doesn’t get used — regardless of how good the downstream model is.
Feature Engineering
From the validated data, the pipeline extracted 196 statistical features per eye — min, max, mean, variance, percentiles (5th, 25th, 50th, 75th, 95th), skewness, and kurtosis — computed across all surface measurements and diameter zones. It also reconstructed 11 topography maps, normalized and resized to 256×256 for CNN input.
Continuous variables were z-score normalized, categorical variables one-hot encoded, and missing values imputed with medians. The dataset was split 70/15/15 (train/validation/test) with 3-fold cross-validation.
The entire pipeline is designed to be reusable. The same code that processed these 120 eyes runs on incoming exams in the hospital’s production environment — the only difference is that new data flows through automatically instead of being manually exported.
Models
Classification with XGBoost
For the binary task (visual gain >1 line vs. ≤1 line), we used XGBoost with grid-searched hyperparameters. The model achieved a Youden Index of 1.0 on the test set — every sample correctly classified. The test set was small, so this result comes with that caveat, but the model consistently identified the right features: preoperative LogMAR DCVA, keratometry values, and corneal curvature metrics.
Regression with CatBoost
CatBoost handled the quantitative predictions:
| Target | R² | MAE |
|---|---|---|
| LogMAR DCVA | 0.59 | 0.07 (~0.7 lines) |
| Mean Keratometry | 0.76 | 1.08 D |
| Corneal Asphericity (Q) | 0.54 | 0.29 |
CatBoost was a natural fit here — it handles categorical features natively and performs well on tabular data with nonlinear relationships. Preoperative visual acuity and corneal curvature measurements were the dominant predictors across all targets.
CNN — Modified VGG16
We also tried a modified VGG16 in PyTorch, taking the reconstructed 256×256 topography maps as input. Performance was significantly lower (R²=0.10 for LogMAR). Not surprising — spatial approaches tend to struggle on datasets this small, and the tabular features already captured the relevant signal well. The CNN experiment was worth running to confirm that the engineered features weren’t leaving information on the table.
Results
Across the cohort, ICRS surgery produced on average:
- 2 lines of visual acuity gain
- 1.84 D cylinder reduction
- 2.86 D keratometry decrease
The main takeaway: preoperative corneal metrics — keratometry and asphericity in particular — were far more predictive of outcomes than the ring segment parameters. This matches clinical intuition: the cornea’s starting condition matters more than the specifics of the implant.
From a practical standpoint, these models could help identify the ~25% of patients who won’t benefit from ICRS and redirect them toward alternatives earlier — sparing them a procedure that wouldn’t help and the recovery time that comes with it.
Conclusion
This project sits at the intersection of classical ML and clinical medicine. Small dataset, high-dimensional features, real stakes. The ensemble methods clearly outperformed deep learning here, which reinforces a point that’s easy to forget: CNNs aren’t the default answer, especially when you have strong domain-specific features and limited samples.
More importantly, this study validated the full data pipeline — from raw polar-coordinate device exports to clinical predictions — that now forms the backbone of the MLOps infrastructure I’m building at Quinze-Vingts. The same code that processed these 120 research cases runs in production, handling incoming exams for 24/7 AI-assisted diagnosis. The research proved the models work; the engineering makes them available when clinicians need them.
The full paper (Perez E*, Louissi N*, et al., Cornea, 2025) is available here. If you’re working on similar problems — especially around building ML infrastructure for clinical environments — feel free to connect on LinkedIn.